<< Main Manual

Tutorial #3. Importing electrophysiology data

PhysImage currently can read gap-free recording of pClamp 9/10 ABF files even while the files are still being written to disk. However, it uses the notion of an "epoch" to import the data. An epoch will typically be the electrophysiology data acquired over a range of time like during a simultaneous image acquisition.

Example #1

Below is an annotated screenshot showing the ElectrophysManager. This can be opened by going to Analyze->Electrophys Manager.

tutorial3_1

Within the ElectrophysManager, experiments can be navigated rather easily. The far left list (1) allows rapid switching between experiments (e.g., on a particular day), while the second to left list (2) provides all the comment tags from the .abf files or any additional ones that can be added by right-clicking and selecting the appropriate option from the popup.

tutorial3_2
Double-clicking a comment allows you to change it.

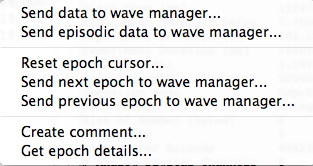
The next list (3) shows all the .abf files in the base directory and selecting one will place the corresponding meta-data into panel (4), which includes the comment tags and the respective time within the file. Right-clicking an .abf file shows a popup like this:
tutorial3_3
In both that popup, and the previous one, there are options to send the data to the WaveManager. By default, the extent imported is the full extent of the file and all channels as separate 'Waves', but an arbitrary start/stop times can be entered instead. 'Episodic data' refers to data from an 'Episodic stimulation' experiment in pClamp-speak.

Resetting the epoch cursor will put it at the beginning of the file, while 'Send next epoch..." will send the next logical epoch to the WaveManager. Finally 'Get epoch details' will import a table as already seen above in panel (5). If you have epochs found that
way, select an epoch, give it a name in the approriate cell and press 'Enter' to make sure the change takes effect. It can then be imported into the WaveManager by right-clicking the epoch and selecting the appropriate option as follows:

tutorial3_4

Example #2

Below is a scripting example showing how to load the most recently acquired epoch from an .abf file corresponding to a recently acquired imaging time-series.

>>> abfFile = getLastABFFile()
>>> tLength = 0.0
>>> expectedLength = (Configuration_.getLastStreamLength() / Configuration_.getImageSamplingRateHz())
>>> eMan = ElectrophyiologyManager.getInstance()
>>>
>>> # Keep pulling epochs from the .abf file until we get the desired length
>>> while (tLength < expectedLength):
...    tLength = eMan.sendNextEpochToWaveManager(abfFile)

After the data is in the WaveManager it can be manipulated or plotted as a chart in the previously demonstrated ways.

<< Tutorial #2. Chart generation of time-series data
>> Tutorial #4. Online acquisition of ΔF/F data

<< Main Manual